Most Quarterly Business Reviews are a waste of time. They become one-sided data dumps that feel like a contractual obligation, not a strategic conversation. A well-designed QBR template changes this. It shifts the focus from backward-looking reports to collaborative, forward-looking strategy.
Why Your Current QBRs Are Falling Flat
If your QBRs feel like a chore, you are not alone. It is a common trap. Many teams present a wall of vanity metrics and usage stats. These numbers often mean little to the client’s actual business goals. The meeting becomes a monologue, not a dialogue. This approach creates disengaged clients who see your meeting as just another calendar invite to endure.
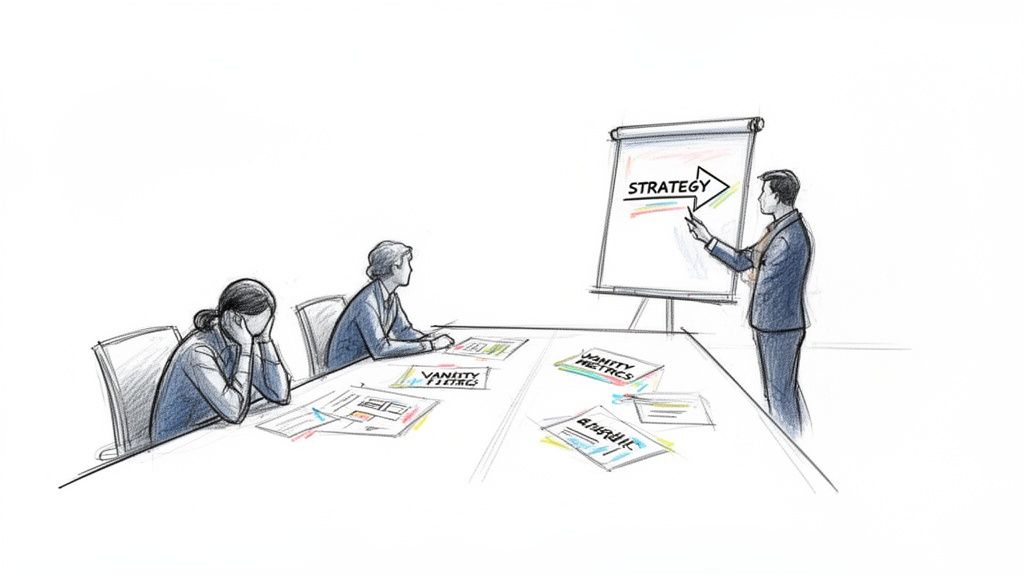
The root of the problem is a misaligned purpose. Your team wants to demonstrate value to secure a renewal. The customer wants to solve their business problems. When your presentation focuses only on your product’s features and your team’s activities, you create a disconnect.
From Report to Partnership
A successful QBR is not a "review." It is a strategic planning session. Its goal is to reinforce the value you deliver and align on what happens next. When you change the objective, you change the meeting's dynamic. You stop being a vendor reporting on activity. You become a partner collaborating on their success.
This mindset shift directly impacts the content you prepare. Instead of just showing data, you start telling a story with it.
From Activities to Outcomes: Do not just show that they used a feature 50 times. Show how that feature helped them save 10 hours of manual work each week. Connect your product to their bottom line.
From Past to Future: Dedicate less than 30% of the meeting to looking back. Spend the other 70% discussing upcoming goals, challenges, and how you can help.
From Monologue to Dialogue: A good rule is the 30/70 split. You should talk for 30% of the time and listen for the other 70%. Use open-ended questions to drive the conversation.
A great QBR feels like a business strategy meeting, not a slide walkthrough. Respect your customer’s time and elevate the conversation to earn a stronger seat at their table.
Setting a Collaborative Tone
To make this shift, you must set the right tone from the start. A powerful technique is to send the slide deck in advance as a "pre-read." This allows your customer to review the data on their own time. The live session is then reserved for high-level discussion instead of reading slides. You should also refresh your team's understanding of what a QBR is to ensure alignment on this approach.
A high-impact QBR builds momentum. It is a critical touchpoint to strengthen partnerships, prove ROI, and turn customers into advocates. Ditching the old data-dump format is the first step.
A great QBR is not a report card. It is a strategic conversation that solidifies your partnership and sets the stage for future growth. Think of it as telling a story about your customer's success, with you as a key character.
This guide provides a proven framework for structuring that story. We will break down each slide, explaining its purpose and how to deliver it effectively using our free QBR template.
The idea is to create a seamless narrative. Each part of your presentation should flow logically into the next. This builds an undeniable case for your value and paves the way for what comes next.
Before diving into the full deck, here is a quick overview of the essential components.
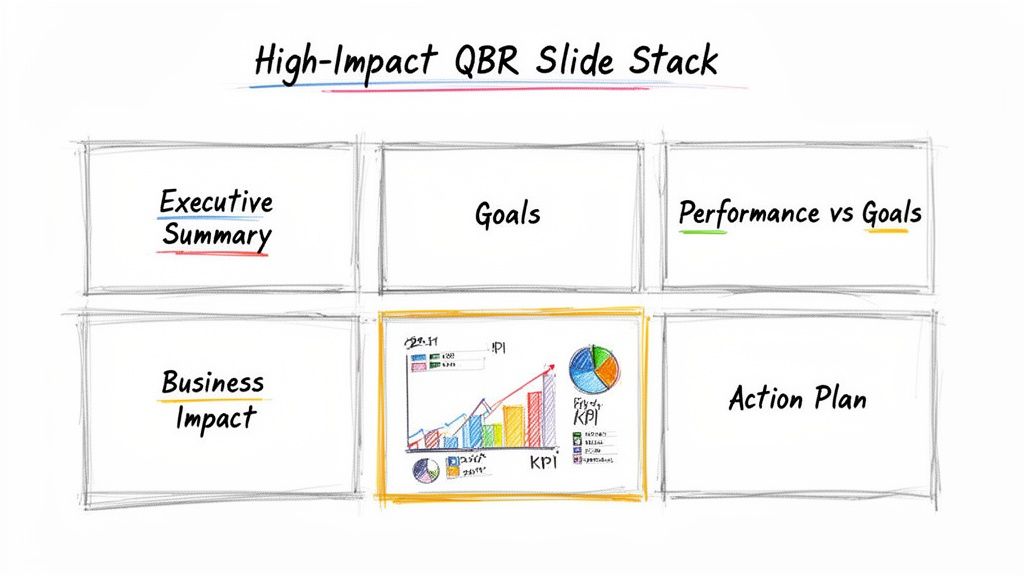
Key Components of a Strategic QBR Deck
Section | Objective | Core Content & Talking Points |
|---|---|---|
Executive Summary | Grab executive attention and immediately show value. | The single biggest achievement from the quarter, framed as a tangible business outcome. |
Review of Past Goals | Build trust and show accountability. | A quick, scannable summary of progress on action items from the last QBR. |
Performance vs. Goals | Tell a compelling story with data. | Trend-based visuals that connect product usage to business objectives. |
Business Impact | Justify the partnership's cost. | A mix of hard numbers (ROI, savings) and qualitative wins (user quotes, success stories). |
Future Planning | Pivot from reviewing the past to co-creating the future. | Collaborative discussion of next quarter's goals, followed by strategic recommendations. |
Structuring your presentation this way keeps the conversation focused on your customer's success.
The Hook: Your Executive Summary
You have about 30 seconds to convince a busy executive that this meeting is worth their attention. Do not waste it with a boring agenda slide.
Start with a powerful executive summary. This is your headline, not a table of contents. Lead with the single most impressive result you helped them achieve last quarter. Frame it in the language they care about: business outcomes. For example, a 15% reduction in onboarding time or £25,000 in new revenue unlocked. This immediately proves you are here to talk about value, not features.
Revisit Past Goals and Commitments
Next, briefly touch on the commitments made during your last QBR. This is not about assigning blame. It is about demonstrating reliability and building trust.
Showing that you tracked and followed through on previous action items speaks volumes. It tells the customer you are an accountable partner. A simple bulleted list or a small table showing each item's status is perfect. Keep it quick and focused on demonstrating follow-through.
The point of reviewing past goals is not to get bogged down in details. It is to prove you are a partner who listens, remembers, and delivers. That earns you the right to talk about the future.
Performance Against Goals: A Story with Data
This is where many QBRs go wrong. They turn into a tedious spreadsheet reading. Your job is to avoid that. Every piece of data you present must tie directly back to the customer's goals.
Do not say, "product usage is up 20%." Connect the dots for them. Say, "We saw your team's adoption of Feature X increase this quarter. This directly correlated with a 10% drop in support tickets for that department." One is a statistic; the other is a story.
Focus your visuals on trends over time. A simple line graph is almost always more powerful than a static number.
Metric: Active User Growth
Don't say: "You have 50 active users."
Do say: "We grew from 30 to 50 active users this quarter. That gets us 80% of the way to the user adoption goal we set in Q1."
Metric: ROI
Don't say: "You saved money."
Do say: "By automating report generation, your team reclaimed an estimated 40 hours this quarter. Based on your team's average loaded cost, that’s roughly £1,200 in productivity savings."
The Payoff: Business Impact and Value Realised
This is the heart of your QBR. Here, you connect all performance data to tangible, bottom-line business impact. You cement your value and make the case for renewal or expansion feel obvious.
Go beyond the numbers and bring the value to life. If you have great feedback from a user, share the direct quote. If you have a story about a team that found a new way to use your product, tell it. Quantify the impact in pounds and pence, even with a conservative estimate. This makes your contribution undeniable. This section of your QBR template is where you justify your partnership.
Charting the Course: Future Planning and Strategic Recommendations
Once you establish the value delivered, pivot the conversation to the future. This is your chance to shift from presenter to strategic partner. The goal is collaboration, not a lecture.
Open the floor to discuss their priorities for the next quarter. What is on their roadmap? What new challenges do they face? Listen carefully.
Based on what you hear, and what you know about your product, prepare two or three specific, strategic recommendations. These are not sales pitches. They are genuine suggestions for how they can get more value from the partnership. You could suggest a new use case or a best practice you have seen work for similar customers. This proactive approach shows you are invested in their long-term success.
Tailoring Your QBR for Different Audiences
A common mistake with QBRs is treating everyone in the room the same. A one-size-fits-all deck does not work. To make these reviews matter, you must speak directly to what each person cares about.
Think of your standard QBR template as a starting point. The real work is filtering every slide and talking point through your audience's perspective. The data you show a Customer Success Manager should look different from what you show an Account Executive.
Let's break down how to pivot your approach for each role.
The QBR for a Customer Success Manager
When meeting with a CSM, your mission is simple. Prove your value, drive product adoption, and get ahead of churn risk. Their world revolves around customer health, happiness, and retention.
Your conversation needs to center on how your partnership makes their accounts healthier and their job easier. Frame your metrics around user engagement and key success milestones.
Go Beyond Usage Data: Do not just show a graph of user activity. Connect the dots. Say, "We noticed Team B has embraced the new reporting feature, and their support tickets have dropped by 25% as a result. That’s a great story we could share with other teams."
Anticipate Problems: CSMs worry about being blindsided by an unhappy customer. Bring up challenges yourself. For example, "I saw user activity dipped in the finance department last month. I have a few ideas for a re-engagement plan and would like to work on it with you."
Arm Them with Success Stories: Make their job of proving value internally easier. Give them quotes, wins, and positive feedback from their users. This is valuable for a CSM who needs to show the platform’s impact to their own leadership.
The QBR for an Account Manager
For an Account Manager (AM), a QBR is a chance to think strategically. They focus on the long-term health, profitability, and renewal of the account.
Your discussion should be less about daily clicks and more about the partnership's bigger picture. You are there to help them protect and grow their business.
A QBR with an Account Manager should feel less like a performance review and more like a joint strategy session. You are partners in demonstrating and expanding the value delivered to the end client.
Come to the meeting ready to talk about how you contribute to their long-range goals. Show them how you are helping to make the account relationship indispensable. This solidifies your position as a crucial partner, not just another expense.
The QBR for an Account Executive
When an Account Executive (AE) joins a QBR, their focus is on growth. They are looking for signals that point to an upsell or cross-sell opportunity.
Your job is to help them spot these openings organically. This makes the QBR feel more like a discovery session than a formal review.
Connect Future Goals to New Solutions: As the customer discusses their plans, listen for new challenges. This is your opening.
Tie Pain Points to Products: When a customer mentions a new struggle, you can naturally say, "That's an interesting challenge. We've seen other clients solve a similar problem using our [Advanced Module/New Product]."
Use Data to Build the Business Case: Present metrics that show the customer is outgrowing their current plan. For example, "Your team has already hit 95% of their data storage limit this quarter. As you scale, we should discuss what an upgrade might look like."
By adjusting your QBR this way, you host a relevant, strategic conversation that gives everyone what they need.
Weaving a Story with Your Data
Raw numbers are just noise until you give them meaning. An effective QBR uses storytelling to transform data into a clear narrative. This story shows where your customer has been, the progress they have made, and the opportunities ahead.
Stop focusing on your product's metrics. Start focusing on their business outcomes. A slide showing a 20% jump in feature adoption is not meaningful to your customer.
Instead, try this: "We saw a 20% increase in your team's adoption of the new module. This directly corresponds to the 15% drop in manual data entry you wanted. We estimate that's freed up about 10 hours of your team’s time every week." Now you have a story worth telling.
Making Your Data Visual and Immediate
How you show data is as important as the data itself. Ditch dense tables and complex charts. Create visuals that tell a story at a glance.
Show Momentum with Trend Lines: A simple line chart illustrates progress over the quarter. It frames the conversation around positive momentum, whether it is user growth, cost savings, or efficiency gains.
Highlight Impact with Before-and-Afters: Use bar charts to show the direct effect of your partnership. For example, "support tickets before this feature" versus "support tickets after." The impact becomes undeniable.
Pinpoint Engagement with Heatmaps: A heatmap can instantly show which departments are engaged and which need more help. This helps identify champions and areas needing support.
Getting visuals right makes a difference. For more on creating effective visuals, our guide on forecasting with Power BI offers practical tips. The goal is to make wins obvious and next steps clear.
The Power of the Human Element
Data tells you what happened. People tell you why it mattered. The most memorable QBRs blend hard numbers with real, human stories. This is where you bring your customer's voice into the room.
The most powerful data point you can share is often a direct quote from someone on the front lines, explaining in their own words how you made their job better.
This is not fluff; it is validation. Follow up a chart on efficiency gains with, "And one of your team leads, Sarah, told us she’s now saving an hour a day on reporting." The data suddenly becomes real and personal. It proves you are listening, not just watching dashboards.
This blend of quantitative and qualitative proof is crucial for navigating complex markets. For instance, recent analysis shows businesses in Brazil have been resilient to global trade pressures, ranking 4th among key emerging markets despite high tariff rates. This is often tied to a focus on operational efficiency and strategic agility—the very things a great data story can highlight. You can find more on this type of analysis in a report on Brazil's trade resilience on maplecroft.com.
By weaving the customer's voice into your data, your insights become more credible. Your recommendations feel less like a sales pitch and more like a shared strategy.
Turning QBRs Into Actionable Momentum
A great QBR presentation feels good, but that feeling fades. The hard work is wasted if the momentum disappears after the call. Good ideas get lost, and commitments are forgotten. The QBR becomes a box-ticking exercise instead of a growth driver.
The biggest mistake is having no systematic follow-through. To prevent value from leaking, you need a simple, repeatable workflow. This workflow turns every discussion point into a documented action. It builds a clear system that holds both you and your customer accountable.
Create Your System of Record
After the meeting, your first job is to get everything into a single source of truth. Do not let your notes die in a forgotten document. That is where accountability fails.
Your CRM should be the home for this information. Create a post-QBR summary that is a concise brief for anyone who touches the account. It should not be a transcript, but a sharp, scannable overview of what matters.
This is part of telling a continuous story with data that leads to action.
The QBR meeting is where you build the narrative. The follow-up is where you make the story happen.
The Post-QBR Checklist
Use a checklist to make this process routine. It removes guesswork and ensures consistent follow-up. Here is a practical breakdown you can adapt.
Immediate Follow-Up (Within 24 Hours)
Your window for impact is short, so move fast.
Send the Recap Email: Send a thank-you email to the customer right away. Keep it brief, summarize key decisions, and attach the final presentation deck.
Log Notes in the CRM: This is critical. Update the account record with your detailed notes. Use a consistent format to capture goals, challenges, quotes, and action items.
Assign Every Action Item: For every next step, create a task in your CRM or project management tool. Assign it a clear owner and a firm due date.
A task without an owner and a deadline is just a suggestion. Every promise made in the QBR must become a trackable action item.
Internal Handoffs (Within 48 Hours)
Now, mobilize your internal team.
Brief Your Internal Crew: Book a quick 15-minute huddle with your internal team (Sales, CS, Support). Run through the key takeaways and clarify who owns what.
Update the Pipeline: If the QBR uncovered an upsell or cross-sell opportunity, get it into the CRM immediately. Update the deal stage, potential value, and expected close date. Add the context from the meeting to the opportunity notes.
Flag Any Risks: If the conversation raised red flags about churn, flag the account in your CRM and loop in leadership. Document the reasons for the risk and the mitigation plan.
Following a disciplined process ensures the QBR's value lasts long after the meeting. You create a closed-loop system where discussion leads to tracked action, and everyone sees the progress. This transforms a quarterly review from a report into an engine for customer growth and retention.
Getting Your QBRs Right: Your Questions Answered
Even with the best template, practical questions come up. Getting these details right can be the difference between a meeting that builds momentum and one that falls flat. Let’s tackle the most common ones.
How Often Should We Actually Hold a QBR?
The "Q" in QBR can be misleading. While it stands for quarterly, the right rhythm is whatever makes sense for your customer.
For a high-touch, strategic account, a quarterly check-in is probably vital. But for a more stable, mature customer, a bi-annual strategy session might be a better use of everyone's time.
The key is not the "quarterly" part; it is finding a consistent, predictable rhythm. Agree on a cadence that works with your customer’s planning cycle and stick to it. This makes the meeting an expected, valuable part of the partnership.
Who Needs to Be in the Room?
Getting the right people to attend is half the battle. An effective QBR must bridge the gap between daily work and big-picture strategy. This means you need representatives from both sides.
On your team: Your Account Manager or Customer Success Manager must be there. For your most important accounts, bringing a senior leader sends a powerful message of commitment.
On the client's team: You need your day-to-day champion, the person who uses your product. Just as importantly, you need their executive sponsor or the economic buyer. This is the person with the authority to approve budgets and make strategic calls.
A QBR without the economic buyer is just a status update. A QBR with the economic buyer is a strategic business meeting. Your goal is to prove the meeting is worth their time.
What's the Ideal Length for a QBR?
Respect your customer's calendar. The sweet spot for most QBRs is 60 minutes.
Anything less feels rushed. Anything much longer, and you will lose people's attention, especially executives. A tight, 60-minute agenda forces you to be concise. It gives you enough time to review data, have a meaningful strategic discussion, and agree on clear next steps.
Stop wasting time turning calls into CRM updates. Samskit is a sales assistant that automatically joins your meetings, extracts key insights like next steps and objections, and drafts accurate updates for your pipeline. Give your team more time to sell by visiting the Samskit website.